It’s not uncommon to hear, as I wander the halls at UBC, faculty complaining about students preoccupied with their computers and phones in class. The most common solution is to just ignore it (“if they don’t want to pay attention to the class, it’s their loss…”) Can’t disagree with that, as long as students aren’t distracting others who are trying to pay attention. Another solution is to ban computers and phones. Well, some students legitimately need their computers (students with disabilities, for example) so I know of a few instructors who ask these students to sit over there, off to the side.
But here’s another solution: don’t forbid phones in class, embrace them.
Naive? Perhaps. Impossible to faciliate? Ye— Ah! Not so fast!
The April 2011 issue of The Physics Teacher contains an article by Angela M. Kelly that describes a collection of iPod Touch apps (which should also on iPhone and iPad) and how to use them to teach Newton’s Laws of Motion. Cool idea: use the games the students are already playing to teach them physics.
I want to add to her list my own favourite physics app. This one’s not a game so it might not – no, who am I kidding, will not – have the same appeal. But xSensor (which, at the time I write this, is free!) is a great physics app because it gives a real-time readout of the accelerometer, in the x-, y- and z-directions. The pix below are screenshots from my iPhone (captured with that magical “click on/off and home buttons at the same time” feature.) Here are a couple of screenshots that show some cool physics. The app will also record the data in a log you can email yourself.
xSensor screenshot showing circular motion. The sinusoidal curves encode the constant centripetal force.
I made this one by putting my iPhone flat on my desk and swirling it around and around. The curves sweeps across the screen recording about 5 seconds of readings. The numbers on the screen, 0.02, -0.14 and -1.18 are the instantaneous accelerations measured in g’s. The z-acceleration is pretty constant at -1 g. Can’t get rid of gravity… The accelerations in the x-direction and y-direction show beautiful sinusoidal motion, 90 degrees out-of-phase, encoding the centripetal force of the phone’s circular motion. It’s shaky because I can’t swirl my phone smoothly.
Okay, the “can’t get rid of gravity…” line was a strawman. Because you can. If you drop your phone. Which I did. Very carefully.
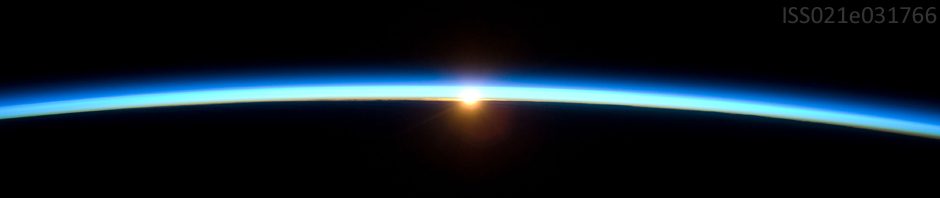
xSensor screenshot during free fall when, for a brief moment, the phone recorded zero acceleration.
These graphs show me holding my phone still. About halfway through the plot, I dropped it. For a short period of time, the acceleration in z-direction snaps up to zero g’s: free fall! Then there’s a big blip as I clumsily catch my phone and take the screenshot. But there, just for that moment in free fall, my phone appeared to be force free. That’s Einstein’s Principle of Equivalence: floating free in deep space is just like freely falling in a gravitational field. (That NASA link include the famous Apollo 15 hammer/feather drop video.) It’s not a Gedankenexperiment, though. It’s the real thing, right there in your hand! Well, you know what I mean.
So, don’t ban phones from your physics, astronomy or science classrooms: embrace them! Better yet, chuck ’em across the room!
Do you have a favourite physics app? Have you discovered another cool experiment you can do with xSensor? Hope you’ll share it with us.
How often have you heard your fellow instructors lament,
I don’t know why I bother with comments on the exams or even handing them back – students don’t go over their exams to see where they what they got right and wrong, they just look at the mark and move on.
If you often say or think this, you might want to ask yourself, What’s their motivation for going over the exam, besides “It will help me learn…”? But that’s the topic for another post.
In the introductory gen-ed astronomy class I’m working on, we gave a midterm exam last week. We dutifully marked it which was simple because the midterm exam was multiple-choice answered on Scantron cards. And calculated the average. And fixed the scoring on a couple of questions where the question stem was ambiguous (when you say, “summer in the southern hemisphere, do you mean June or do you mean when it gets hot?”). And we moved on.
Hey, wait a minute! Isn’t that just what the students do — check the mark and move on?
Since I have the data, every student’s answer to every question, via the Scantron and already in Excel, I decided to “go over the exam” to try to learn from it.
(Psst: I just finished wringing some graphs out of Excel and I wanted to start writing this post before I got distracted by, er, life so I haven’t done the analysis yet. I can’t wait to see what I write below!)
Besides the average (23.1/35 questions or 66%) and standard deviation (5.3/35 or 15%), I created a histogram of the students’ choices for each question. Here is a selection of questions which, as you’ll see further below, are widespread on the good-to-bad scale.
Question 9: You photograph a region of the night sky in March, in September, and again the following March. The two March photographs look the same but the September photo shows 3 stars in different locations. Of these three stars, the one whose position shifts the most must be
A) farthest away
B) closest
C) receding from Earth most rapidly
D) approaching Earth most rapidly
E) the brightest one
Students' choices for Question 9. The correct answer is B.
Question 16: What is the shape of the shadow of the Earth, as seen projected onto the Moon, during a lunar eclipse?
A) always a full circle
B) part of a circle
C) a straight line
D) an ellipse
E) a lunar eclipse does not involve the shadow of the Earth
Students' choices for Question 16. The correct answer is B.
Question 25: On the vernal equinox, compare the number of daytime hours in 3 cities, one at the north pole, one at 45 degrees north latitude and one at the equator.
A) 0, 12, 24
B) 12, 18, 24
C) 12, 12, 12
D) 0, 12, 18
E) 18, 18, 18
Students' answers to Question 25. The correct answer is C.
How much can you learn from these histograms? Quite a bit. Question 9 is too easy and we should use our precious time to better evaluate the students’ knowledge. The “straight line” choice on Question 16 should be replaced with a better distractor – no one “fell for” that one. I’m a bit alarmed that 5% of the students think that the Earth’s shadow has nothing to do with eclipses but then again, that’s only 1 in 20 (actually, 11 in 204 students – aren’t data great!) We’re used to seeing these histograms because in class, we have frequent think-pair-share episodes using i>clickers and use the students’ vote to decide how to proceed. If these were first-vote distributions in a clicker question, we wouldn’t do Question 9 again but we’d definitely get them to pair and share for Question 16 and maybe even Question 25. As I’ve written elsewhere, a 70% “success rate” can mean only about 60% of the students chose the correct answer for the right reasons.
I decided to turn it up a notch by following some advice I got from Ed Prather at the Center for Astronomy Education. He and his colleagues analyze multiple-choice questions using the point-biserial correlation coefficient. I’ll admit it – I’m not a statistics guru, so I had to look that one up. Wikipedia helped a bit, so did this article and Bardar et al. (2006). Normally, a correlation coefficient tells you how two variables are related. A favourite around Vancouver is the correlation between property crime and distance to the nearest Skytrain station (with all the correlation-causation arguments that go with it.) With point-biserial correlation, you can look for a relationship between students’ test scores and their success on a particular question (this is the “dichotomous variable” with only two values, 0 (wrong) and 1 (right).) It allows you to speculate on things like,
(for high correlation) “If they got this question, they probably did well on the entire exam.” In other words, that one question could be a litmus test for the entire test.
(for low correlation) “Anyone could have got this question right, regardless of whether they did well or poorly on the rest of the exam.” Maybe we should drop that question since it does nothing to discriminate or resolve the student’s level of understanding.
I cranked up my Excel worksheet to compute the coefficient, usually called ρpb or ρpbis:
where μ+ is the average test score for all students who got this particular questions correct, μx is the average test score for all students, σx is the standard deviation of all test scores, p is the fraction of students who got this question right and q=(1-p) is the fraction who got it wrong. You compute this coefficient for every question on the test. The key step in my Excel worksheet, after giving each student a 0 or 1 for each question they answered, was the AVERAGEIF function: for each question I computed
=AVERAGEIF(B$3:B$206,”=1″,$AL3:$AL206)
where, for example, Column B holds the 0 and 1 scores for Question 1 and Column AL holds the exam marks. This function takes the average of the exam scores only for those students (rows) who have got a “1” on Question 1. At last then, the point-biserial correlation coefficients for each of the 35 questions on the midterm, sorted from lowest to highest:
Point-biserial correlation coefficient for the 35 multiple-choice question in our astronomy midterm, sorted from lowest to highest. (Red) limits of very weak to strong (according to the APEX disserations article) and also the (green) "desirable" range of Bardar et al. are shown.
First of all, ooo shiney! I can’t stand the default graphics settings of Excel (and PowerPoint) but with some adjustments, you can produce a reasonable plot. Not that this in is perfect, but it’s not bad. Gotta work on the labels and a better way to represent the bands of “desirable”, “weak”, etc.
Back to going over the exam, how did the questions I included above fare? Question 9 has a weak, not desirable coefficient, just 0.21. That suggests anyone could get this question right (or equivalently, no could get this question right). It does nothing to discriminate or distinguish high-performing students from low-performing students. Question 16, with ρpb = 0.37 is in the desirable range – just hard enough to begin to separate the high- and low-performing students. Question 25 is one of the best on the exam, I think.
In case you’re wondering, Question 6 (with the second highest ρpb ) is a rather ugly calculation. It discriminated between high- and low-performing students but personally, I wouldn’t include it – doesn’t match the more conceptual learning goals IMHO.
I was pretty happy with this analysis (and my not-such-a-novice-anymore skills in Excel and statistics.) I should stopped there. But like a good scientist making sure every observation is consistent with the theory, I looked at Question 26, the one with the highest point-biserial correlation coefficient. I was shocked, alarmed even. The most discriminating question on the test was this?
Question 26: What is the phase of the Moon shown in this image?
A) waning crescent
B) waxing crescent
C) waning gibbous
D) waxing gibbous
E) third quarter
It’s waning gibbous, by the way, and 73% of the students knew it. That’s a lame, Bloom’s taxonomy Level 1, memorization question. Damn. To which my wise and mentoring colleague asked, “Well, what was the exam really testing, anyway?”
Alright, perhaps I didn’t get the result I wanted. But that’s not the point of science. Of this exercise. I definitely learned a lot by “going over the exam”, about validating questions, Excel, statistics and WordPress. And perhaps made it easier for the next person, shoulders of giants and all that…
I was creating a worksheet for our #astro101 class about the expansion of the Universe. If the Universe is expanding at a uniform rate, it’s about 14 billion years old. If the expansion is accelerating (decelerating), a little logic tells us the Universe must be older (younger) than 14 billion years.
I wrote the worksheet as a ranking task (“Rank the 3 models by expansion rate 1 billion years ago” and so on) using the great collection at UNL as a template. There’s also a nice graph that helps summarize the current, past and future expansion of the 3 models. This is the graph for my analogy of 3 runners, Connie (who runs at a constant rate), Alice (who accelerates) and Deena (who decelerates) practicing for a 100-metre race. The Universe version is identical except “distance” is “size of the Universe” and “cross finish line” is “now”.)
I agonized (well, that’s a bit strong but you know what I mean) over getting the students to draw the 3 curves for the uniform, accelerating and decelerating Universes or getting them to identify and label the curves given in a diagram. Fortunately, we have nice set of learning goals for the course and one says, “You will be able to sketch different scenarios for the evolution of the size of the Universe, including when the Big Bang happened and the fate of the Universe.” That clearly told me to use “Sketch…” instead of “Label…”
Great. But is “sketch” the right verb? Soon, as a colleague and I started listing all the graphing nouns and verbs we use interchangeably, I realized once again that students most likely have many interpretations of these words. My “expert” interpretation is different than their “novice” interpretation of words like
sketch
draw
graph (noun and verb)
axes
diagram
figure
plot (noun and verb)
curve
function
It’s not inconceivable that a student could be asked to “graph the graph on the graph” or “plot the plot on the plot”. Ay caramba!
In the end, I asked the students first to “write labels Connie, Alice and Deena next to each runner’s curve in the graph” (the one above). I figured that showed them the critical feature of the story, that all three runners crossed the line at the same time and going the same speed. Then later I asked
This graph shows the size of the Universe at each time for the uniform expansion model. Sketch the curves for the accelerating and decelerating universes. Remember that all curves must go through the current Universe and all curves must have the same slope at that point because the slope is the Hubble Constant. Label the curves accelerating and decelerating.
The students spent about 15 minutes on the worksheet. I’m happy to report that 103 of 115 (or 90%) of the students correctly chose C) older on this post-activity clicker question
If we discover the Universe is expanding at an accelerated rate, it means the Universe is
A) younger than 14 billion years
B) 14 billion years old
C) older than 14 billion years