Category: research

Supporting SoTL

Scholarly teaching. Education research. Scholarship of Teaching and Learning. These are all activities related to applying valid research methods – typically developed in other disciplines – to study teaching and learning.

For faculty members who’s merit, tenure, and promotion is based, in part, on their research output, publishing articles about education can’t hurt but it may not be seen as important as their disciplinary research. UBC, like a growing number of universities, has a tenure-track stream of Assistant, Associate, and (full) Professor of Teaching. We call it the Educational Leadership stream because success and promotion requires demonstrating impact and leadership beyond your classroom. For faculty in this stream, engaging in SoTL is a powerful way to demonstrate that leadership.

It’s my Centre for Teaching and Learning’s mission to “promote, inspire, and support excellence, leadership, scholarship, and technologies in teaching and learning.” I find supporting scholarship is one of most difficult part of our mission because when we start talking about research, each faculty member immediately snaps to the kinds of disciplinary research they do – if any – and tries to force education into that methodology. I struggle to support them because (i) I don’t know what kind of research they do and (ii) I’m most familiar with research methods found in STEM.

I’m writing this post because something happened last week, something good, that’s changed my approach and, I hope, the success of the faculty members I work with. Here’s the story. Dr. Jasmin Hristov, a research-stream Assistant Professor in the Department of History & Sociology, Irving K. Barber School of Arts and Sciences gave me her permission to tell it.

Professor Hristov teaches upper-level sociology. She plans to bring in a series of guest speakers via video conference and asked if she could use my Centre’s workshop room. “Yes, of course,” I replied. And then, thinking about my Centre’s mission, I added, “You’re doing something innovative – would you be interested in talking about how you could study whether or not it’s effective?” She was, and we met.

First, Professor Hristov described her motivation: introduce the students to six experts from around the World, with careful attention to diversity of gender, race, location, and rank. For each guest speaker, the students do some background reading, prepare questions to ask the speaker, and lead a discussion. After class, the students write a reflection about the experience.

“How can we tell if it was effective? How can we tell if students learned anything?”

We nearly got lost down a dead end. Professor Hristov: “I’ve taught this course before without the video conferencing but with different students and, obviously, without the reflection.” Both of us nearly concluded, “Without a control group to compare grades against, I don’t see how we can study this.”

We didn’t go there, though, because serendipitously, I started the conversation with,

How can we find evidence of impact?

This question opened up whole new ways of thinking, without sending us on that narrow “research = A/B study with statistical significance” path. It led quickly to a couple of possibilities that could produce interesting results that don’t rely on the success or failure of p < 0.05.

Text analysis of students’ reflection

4-page reflection × 6 reflections × 30 students = huge amount of text

Imagine examining all that text with powerful tools like Voyant or NVivo. Will students naturally comment on the diversity of the speakers? That was one of the elements deliberately built into this intervention, recall. Do they need a prompt? Not a heavy prompt like, “Please comment on the diversity of the speakers.” That will only get the answers the students think Professor Hristov wants to hear. Something more subtle, like, um, not sure yet.

But imagine the kind of evidence of impact she could include in the SoTL article:

“I carefully chose the speakers to expose my students to a wide range of races, locations, genders, and ranks. In their reflections, students made the following associations…”

This isn’t cherry-picking an individual student’s comments – that’s a helpful exemplar or supporting anecdote but it’s not evidence. Instead, we have legitimate connections and insight students are making.

Quantitative analysis of reflection grades

Just because we can’t do a controlled A/B study doesn’t mean we can’t do quantitative analysis. Imagine this: imagine we compare the students’ marks on the reflections with their marks on the rest of the course. The reflections are worth around 1/3 of the total mark, so the reflections are worth enough that students will put legitimate care and effort into them. In other words, the reflections are not some incidental marks students can blow off, and they’re not so important that nothing else matters in the course. I made up some data (thx, RANDOM.org) to see what kinds of conclusions we could make (click to enlarge):

Hypothetical student marks on the reflection and other course assignments, with a range of correlations and conclusions about impact. (Data via RANDOM.org. Graphic: Peter Newbury)

The left graph shows there’s a relationship between the students’ success on the reflections and the rest of the course. Do the reflections help them succeed with the other assignments? Do the other assignments help them write better reflections? Can’t tell. Better look at the text analysis…

The center graph isn’t telling a compelling story. Success on the reflections doesn’t seem to have any connection to success on the rest of the course. We can probably conclude the same about what the students are getting out of the video conferences. Time to rethink how the video conferences are integrated and supported.

The right graph is a worst-case scenario: success on the reflections comes at the expense of the their success in the rest of the course. Oh c’mon, this would never happen, right? Well, I’ve seen courses where there’s a “capstone project” that takes all the students’ time. If the capstone is that important, it should probably represent a significant fraction of the overall course mark, so success on the capstone guarantees success in the course. I’ve also seen cases where success on the capstone requires sacrificing the other courses you’re taking – time for the Department Head to get the course instructors together to coordinate their assignments!

No matter the scenario, there’s something here for Professor Hristov to share in the discussion of her SoTL paper. The conclusions will be useful to others thinking about integrating video conferencing into their courses.

Evidence of Impact

This will be my new conversation starter when promoting, inspiring, and supporting scholarship. It’s also a good prompt for the faculty members, themselves, who want to (need to?) demonstrate educational leadership. This prompt invites us to be curious and creative, instead of trying to jam teaching and learning into the same research methods that we’re familiar with from disciplinary research.

Align your NSF DUE grant proposal with these 11 landmark works

I spent April 24, 2015, in two half-day presentations led by David R. Brown in the Division of Undergraduate Education at the National Science Foundation.  Special thanks to my colleague Stacey Bridges for organizing these events.

The first presentation, Dave outlined how the NSF supports innovation in undergraduate science, technology, engineering, math (STEM) education. It was a blizzard of acronyms which Dave patiently translated for us, always with a smile and a twinkle in his eye. One slide, for example, was about

NSF DUE SBIR/STTR Phase IICC

At that stage, it was all traxoline to me.

To summarize what happened in the presentation: the NSF is a complicated organization that funds billions of dollars of research ($7.2 billion this year) including research in undergraduate STEM education.

If you’re looking for a grant to study undergraduate STEM education, you should find your way to the IUSE grants (the evolution of STEP, TUES, and WIDER grants), deep within the NSF:

Improving Undergraduate STEM Education (IUSE)
grant from the
Division for Undergraduate Education (DUE)
in the
Directorate for Education and Human Resources (EHR)
at the
National Science Foundation (NSF)

Writing a Successful DUE Proposal

The afternoon session with Dave was full of advice for writing successful education grant proposals. He had three key messages:

First, the best professional development you can get to help you write successful grants is volunteer to be a grant reviewer.

Second, and I’ll quote Dave:

In order to maximize potential for award, follow the Program Solicitation and Grant Proposal Guide (GPG) with highest fidelity (or face RWR: return without review.)

Third, every grant writer should read and align their proposal with these 11 landmark works.

1. PCAST Report: Engage to Excel

PCAST_ReportThe President’s Council of Advisors on Science and Technology (PCAST) forecasts “a need for producing, over the next decade, approximately 1 million more college graduates in STEM fields” and makes 5 recommendations for reaching this goal:
  1. catalyze widespread adoption of empirically validated teaching practices;
  2. advocate and provide support for replacing standard laboratory courses with discovery-based research courses;
  3. launch a national experiment in post secondary mathematics education to address the mathematics preparation gap;
  4. encourage partnerships among stakeholders to diversify pathways to STEM careers; and
  5. create a Presidential Council on STEM Education with leadership from the academic and business communities to provide strategic leadership for transformative and sustainable change in STEM undergraduate education.

Source: look for full report plus an executive summary by finding the 2012 “Undergraduate STEM Education Report” at the PCAST Documents and Reports.


2. CoSTEM 5-Year Strategic Plan

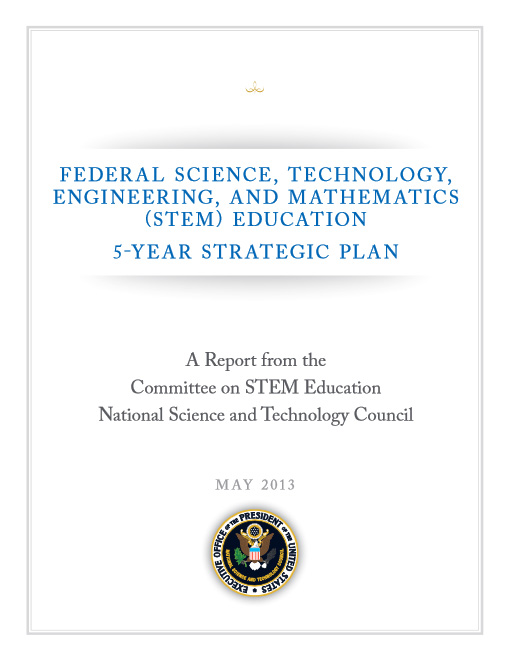
CoSTEM_ReportIn May, 2013, the Committee on STEM Education (CoSTEM) within the National Science and Technology Council released, “Federal Science, Technology, Engineering, and Mathematics (STEM) Education 5-Year Strategic Plan.” The report recommends 5 areas for STEM Education investment:

  1. Improve STEM instruction.
  2. Increase and sustain youth and public engagement in STEM.
  3. Enhance the STEM experience of undergraduates.
  4. Better serve groups historically underrepresented in STEM.
  5. Design graduate education for tomorrow’s STEM workforce.

Source: Look for the full Federal STEM Strategic Plan at the Office of Science and Technology Policy.


 3. DBER Report

DBER_ReportIn 2012, the National Research Council published the Discipline-Based Education Research (DBER) Report. It describes how each of the STEM disciplines can address 3 key issues:

  1. Student-centered learning strategies can enhance learning more than traditional lectures.
  2. Students have incorrect understandings about fundamental concepts.
  3. Students are challenged by important aspect of the domain that can seem easy or obvious to experts.

Source: download a copy of the DBER Report or read it online through the National Academies Press.


ReachingStudents4. Reaching Students by Nancy Kober (2015)

Dave calls this a “Follow-up to DBER Report for Practitioners” and a “How-to guide for DBER”. At the CIRTL Forum in April 2015, Myles Boylan, Lead Program Director at the NSF DUE, highlighted this report, too.

Source: download a copy of Reaching Students or read it online through the National Academies Press.


5. “The Similarities Between Research in Education and Research in the Hard Sciences” by Carl Wieman

Carl Wieman is a Nobel-prize winning physicist who’s spend the last decade researching how undergraduates learn and how to train instructors to design and teach active classes using evidence-based practices. The Carl Wieman Science Education Initiative at the University of British Columbia is a fantastic resources for teaching and learning in higher education. (Full disclosure – I spent 5 years working at UBC in the CWSEI before going to the University of California, San Diego. That experience continues to be the foundation of my work.) Carl also spent time in the Office of Science and Technology Policy (OSTP), the organization responsible for the PCAST Report.

Source: Wieman, C. (2014). The Similarities Between Research in Education and Research in the Hard Sciences. Educational Researcher 43 (1), pp. 12-14. doi: 10.3102/0013189X13520294


6. “Active learning increases student performance in science, engineering, and mathematics” by Freeman et al.

(A) In active classes, students’ grades increased by about 0.5 standard deviations — about half a grade. (B) Far fewer students fail in active classes. (Source: Freeman et al. 2014)

This landmark paper by Freeman et al. describes a meta-analysis of 225 published studies that measured student performance in traditional lecture vs. active learning classrooms. The evidence is overwhelming that active classes are more effective. As the authors put it, if this was a medical study where students in active classrooms were given an experimental treatment with the traditional, lecture-based classrooms as the control, they’d stop the study and give everybody the experimental treatment. Wired blogger Aatish Bhatia wrote a great summary of the paper and Carl Wieman published a short commentary.

Source: Freeman, S., Eddy, S.L., Miles McDonough, M., Smith, M.K., Okoroafor, N., Jordt, H., & Wenderoth, M.P. (2014). Active learning increases student performance in science, engineering, and mathematics. PNAS 2014 111 (23) 8410-8415. doi:10.1073/pnas.1319030111


7. Describing & Measuring Undergraduate STEM Teaching Practices (2013)

DescribingAndMeasuring_cover
The book is the result of a AAAS/NSF meeting that drew participants from nearly 50 institutions to identify tools and techniques that can be used in describing teaching practices. It discusses five techniques that individuals or organizations can use to measure STEM teaching: faculty and student surveys, interviews, classroom observations and teaching portfolios. The best descriptions of STEM teaching typically involve the use of multiple techniques, the book concludes. (source)

Source: You can get a PDF from the meeting website (follow the “Describing and Measuring Teaching Practices” link)


8. Project Evaluation

ProjectEval2002_cover This “User-Friendly Handbook” covers

  • Evaluation and Types of Evaluations
  • Steps in the Evaluation Process
  • An Overview of Quantitative and Qualitative Data Collection Methods
  • Strategies That Address Culturally Responsive Evaluation

Source: Section by section PDFs and a PDF of the entire 2002 document are available here. There’s a 2010 edition (PDF), too, but Dave didn’t mention it.


9. Center on Education and the Workforce at Georgetown University

The PCAST report, recall, calls for 1 million more college graduates in STEM fields. Not 1 million more faculty, researchers, graduate students, and postdocs but on undergraduates who will graduate and then do what? Join the workforce. The NSF is interested in funding projects that help these undergraduates prepare for those careers. These 2 reports from the Center for Education of the Workforce are resources for education researchers less familiar with life outside the ivory towers of academia.

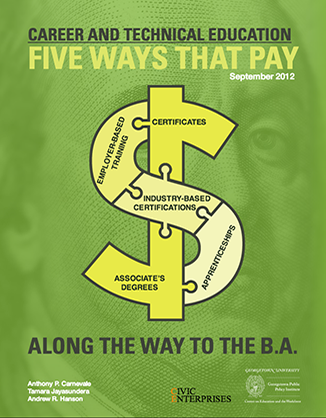
Career and Technical Education: Five Ways That Pay Along the Way to the B.A. stem_CEWGeorgetown_cover

Source: Five Ways That Pay Along the Way to the B.A. by A.P. Carnevale, T. Jayasundera, & A.R. Hanson (2012). STEM by Anthony P. Carnevale, Nicole Smith, and Michelle Melton (2011).


10. Community Colleges in the Evolving STEM Landscape

CommunityCollegeEvolving_coverRemember, the PCAST calls for an additional 1 million college graduates, not university graduates. Those of us in R1 institutions can’t forget that the teaching and learning research we carry out (ideally, with NSF support) has to be applicable to teaching and learning in 2- and 4-year colleges, too. What does that mean? How are colleges different than universities? Are there any differences in the students? These questions and more are addressed in this report prepared by Steve Olson and Jay B. Labov.

Source: Like the DBER report, this report is published by the National Academies Press and is available online in HTML and PDF.


11. Common Guidelines for Education Research and Development (2013)

CommonGuidelines_IESNSF_cover(Not to be  confused with NSF  Grant Proposal Guide (GPG). These guidelines were developed by the representatives from the Institute of Educational Sciences in the U.S. Department of Education and from the NSF. As Dave puts it, it offers guidance on building the evidence base in STEM learning, including

  • guidelines intended to improve the quality, coherence, and pace of knowledge development in STEM education
  • guidance intended for program officers, prospective grantees, and peer reviewers
  • it is not intended to be prescriptive or exhaustive

For various types of research and development, from those contributing core knowledge to those assessing implementation of interventions, the Common Guidelines describe the

  • Purpose
  • Empirical and theoretical justifications (evidence base)
  • Types of project outcomes (evidence generation)
  • Quality of evidence

Source: A PDF is available from the NSF. Here’s a FAQ about the Common Guidelines.


Remember, the goal is to align your proposal with these works (or at the very least, don’t contradict them.) Dave recommends putting them all on a USB stick and keeping them handy when writing (or reviewing) NSF DUE proposals. And once more, Dave reminds us, follow the Grant Proposal Guide (GPG) “with highest fidelity.”

Good luck with your grant proposal!

The Power of Misconception

“Misconception” is one of those words that makes you slump your shoulders and sigh. It’s not inspiring like “creativity” or “glee.” In fact, in education circles we often resort to “alternate conception” so we’re not starting the conversation at a bad place.

In this post, I want to share with you some beautiful new research on how misconception affects teaching and learning.

In the 6 March 2013 issue of the American Education Research Journal, Philip M. Sadler, Gerhard Sonnert, Harold P. Coyle, Nancy Cook-Smith and Jaimie L. Miller describe “The Influence of Teachers’ Knowledge on Student Learning in Middle School Physical Science Classrooms”. Those of us in astronomy education immediately recognize Phil Sadler. His “A Private Universe” video is must-see for every astronomy instructor, K-12 and beyond.

Here’s what Sadler et al. did in the present study.

They created a 20-question, multiple-choice quiz based on concepts taught in middle school science: properties and changes in properties of matter, motion and forces, and transfer of energy. They chose concepts where kids have a common misconception, for example,

Electrical circuits provide a means of transferring electrical energy when heat, light, sound and chemical changes are produced (with common misconception that electricity behaves in the same way as a fluid.) (p. 12)

With the test in hand, they recruited 100’s of seventh and eighth grade science teachers in 589 schools across the U.S. They asked them to give the test at the beginning, middle and end of the year, to look for signs of learning. By the end of testing, there were matching sets of tests from 9556 students and 181 teachers. In other words, a big enough N that the data could mean something.

By looking at the students’ responses, the authors were able to classify the 20 questions into 2 types:

  • for 8 questions, some students got them right, some got them wrong, with no pattern in the wrong answers. They call these “no misconception” questions.
  • for 12 questions, when students got them wrong, 50% or more chose the same incorrect answer, a carefully chosen distractor. These questions are called “strong misconception” questions.

Sadler et al. also had the students write math and reading tests. From their scores, the students were classified as “high math and reading” or “low math and reading”.

They did something else, too, and this is what makes this study interesting. They asked the teachers to write the test. Twice. The first time, the teachers answered as best they could. Their scores are a measure of their subject matter knowledge (SMK). The second time, the teachers were asked to identify the most common wrong answer for each question. How often they could identify the common wrong answer in the strong misconception questions is the teachers’ knowledge of student misconception (KoSM) score.

With me so far? Students with high or low math and reading skills have pre- and post-scores to measure their science learning gain. Teachers have SMK and KoSM scores.

Do you see where this is going? Good.

There’s a single graph in the article that encapulates all the relationships between student learning and teachers SMK and KOSM. And it’s a doozie of a graph. Teaching students how to read graphs, or more precisely, teaching instructors how to present graphs so students learn how to interpret them, is something I often think about. So, if you’ll permit me, I’m going to present Sadler’s graph like I’d present it to students.

First, let’s look at the “architecture” of the axes before we grapple with the data.

Let's look at the axes of the graph first, before the data blind us. (Adapted from [1])
Let’s look at the axes of the graph first, before the data overwhelm us. SMK = teachers’ subect matter knowledge; KoSM is the teachers’ knowledge of student misconceptions.  (Adapted from Sadler et al. (2013))
The x-axis give the characteristics of the science teachers (no SMK,…, SMK & KoSM) who taught the concepts for which students show no misconception or strong misconception. Why are there 3 categories for Strong Misconception but only 2 for No Misconception? Because there is no misconception and no KoSM on the No Misconception questions. What about the missing “KoSM only” condition? There were no teachers who had knowledge of the misconceptions but no subject matter knowledge. Good questions, thanks.

Cohens_d_4panel_wikipedia_CCThe y-axis measures how much the students learned compared to their knowledge on the pre-test given at the beginning of the school year. This study does not use the more common normalized learning gain, popularized by Hake in his “Six-thousand student” study. Instead, student learning is measured by effect size, in units of the standard deviation of the pretest. An effect size of 1, for example, means the average of the post-test is 1 standard deviation higher than the average of the pre-test, illustrated in the d=1 panel from Wikipedia. Regardless of the units, the bigger the number on the y-axis, the more the students learned from their science teachers.

And now, the results

This is my post so I get to choose in which order I describe the results, in a mixture of  the dramatic and the logical. Here’s the first of 4 cases:

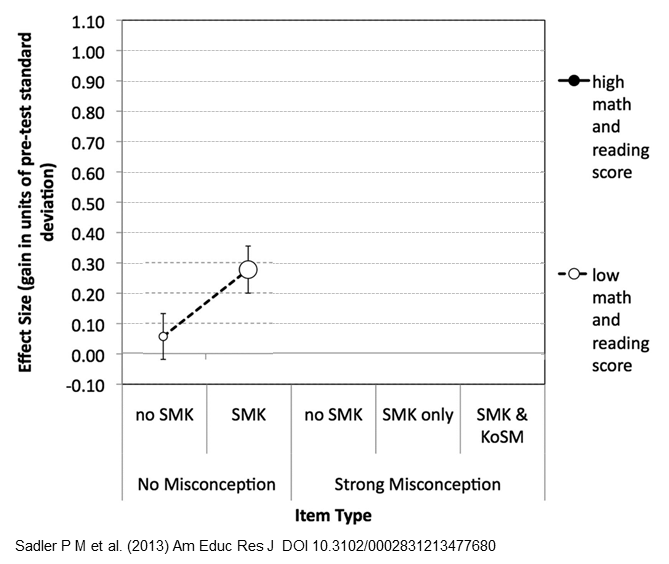
Students who scored low on the reading and math tests didn't do great on the science test, though the ones who had knowledgeable teachers did better. (Graph adapted from Sadler et al. (2013))

The students who scored low on the reading and math tests didn’t do great on the science test either, though the ones who had knowledgeable teachers (SMK) did better. Oh, don’t be mislead into thinking the dashed line between the circles represents a time series, showing students’ scores before and after. No, the dashed line is there to help us match the corresponding data points when the graph gets busy. The size of the circles, by the way, encodes the number of teachers with students in the condition. In this case, there were not very many teachers with no SMK (small white circle).

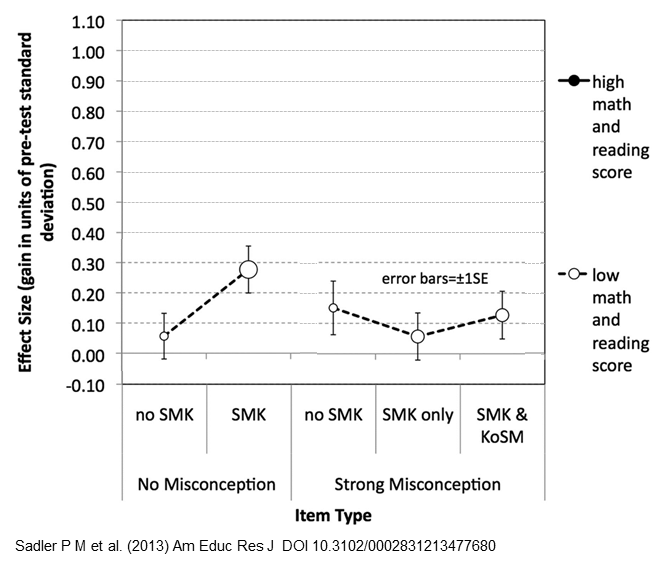
Next, here are the learning gains for the students with low math and reading scores on the test questions with strong misconceptions:

Students with low math and reading scores did poorly on the strong misconception questions, regardless of the skill of their teachers. (Adapted from Sadler et al. (2013))
Students with low math and reading scores did poorly on the strong misconception questions, regardless of the knowledge of their teachers. (Adapted from Sadler et al. (2013))

Uh-oh, low gains across the board, regardless of the knowledge of their teachers. Sadler et al. call this “particularly troubling” and offer these explanations:

These [strong misconception questions] may simply have been misread, or they may be cognitively too sophisticated for these students at this point in their education, or they many not have tried their hardest on a low-stakes test. (p. 22)

Fortunately, the small size of the circles indicates there were not many of these.

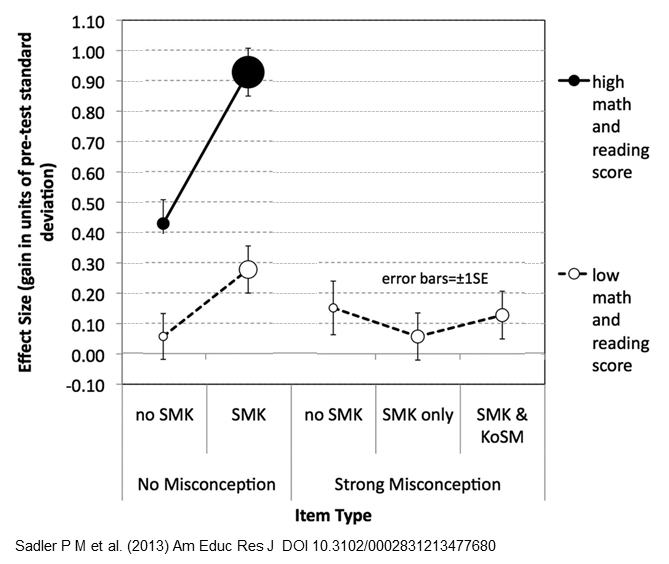
What about the students who scored high on the math and reading tests? First, let’s look at their learning gains on the no-misconception questions. [Insert dramatic drum-roll here because the results are pretty spectaculars.]

Students with knowledgeable teachers exhibited huge learning gains. (Adapted from Sadler et al. (2013))

Both black circles are higher than all the white circles: Even the students with less-knowledgeable teachers (“no SMK”) did better than all the students with low math and reading scores. The important result is how much higher students with knowledgeable teachers scored, represented by the big, black circle just north of effect size 0.9. Science teachers with high subject matter knowledge helped their students improve by almost a full standard deviation. Rainbow cool! The large size of that black circle says this happened a lot. Double rainbow cool!

Finally we get to the juicy part of the study: how does a teacher’s knowledge of the students’ misconceptions (KoSM) affect their students’ learning?

Subject matter knowledge alone isn't enough. To get significant learning gains in their students, teachers also need knowledge of the misconceptions. (Adapted from Sadler et al. (2013))
Subject matter knowledge alone isn’t enough. To get significant learning gains in their students, teachers also need knowledge of the misconceptions. (Adapted from Sadler et al. (2013))

Here, students with knowledgeable teachers (I guess-timate the effect size is about 0.52) do only slightly better than students with less knowledgeable teachers (effect size around 0.44). In other words, on concepts with strong misconceptions, subject matter knowledge alone isn’t enough. To get significant learning on these strong misconception concepts, way up around 0.70, teachers must also have knowledge of those misconceptions.

Turning theory into practice

Some important results from this ingenious study:

  • students with low math and reading skills did poorly on all the science questions, despite the knowledge of their teachers, once again demonstrating that math and reading skills are predictors of success in other fields.
  • Teachers with subject matter knowledge can do a terrific job teaching the concepts without misconceptions, dare we say, the straightforward concepts. On the trickier concepts, though, SMK is not enough.
  • Students bring preceptions to the classroom. To be effective, teachers must have knowledge of their students’ misconceptions so they can integrate that (mis)knowledge into the lesson. It’s not good enough to know how to get a question right — you also have to know how to get it wrong.

Others, like Ed Prather and Gina Brissenden (2008), have studied the importance of teachers’ pedagogical content knowledge (PCK). This research by Sadler et al. shows that knowledge of students’ misconceptions most definitely contributes to a teacher’s PCK.

If you use peer instruction in your classroom and you follow what Eric Mazur, Carl Wieman, Derek Bruff and others suggest, the results of this study reinforce the importance of using common misconceptions as distractors in your clicker questions. I’ll save it for another time, though; this post is long enough already.

Epilogue

Interestingly, knowledge of misconceptions is just what Derek Muller has been promoting over at Veritasium. The first minute of this video is about Khan Academy but after that, Derek describes his Ph.D. research and how teachers need to confront students’ misconceptions in order to get them to sit up and listen.


If you’ve got 8 more minutes, I highly recommend you watch. Then, if you want to see how Derek puts it into practice, check out his amazing “Where Do Trees Get Their Mass From?” video:

Update 6/6/2013 – I’ve been thinking about this paper and post for 3 months and only today finally had time to finish writing it. An hour after I clicked Publish, Neil Brown (@twistedsq on Twitter) tweeted me to say he also, today, posted a summary of Sadler’s paper. You should read his post, too, “The Importance of Teachers’ Knowledge.” He’s got a great visual for the results.

Another Update 6/6/2013  – Neil pointed me to another summary of Sadler et al. by Mark Guzdial (@guzdial on Twitter) “The critical part of PCK: What students get wrong” with links to computer science education.

Navigation