Category: research

The Ups and Downs of Interpreting Graphs

Here’s a graph showing some guy’s position as he’s out for a walk:

This graph shows the position of a guy out for a walk. Can you tell what he's doing?
This graph shows the position of some guy out for a walk. Can you tell what he’s doing?

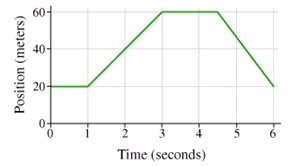
Take a moment and describe in your own words what he’s doing. If you said, “He went up a hill and down again,” I’m sorry, you’re incorrect. But don’t feel bad – that’s a common answer when you ask this kind of question in a first-year physics class.

Andrew Elby calls it WYSIWYG graph interpretation. Robert Beichner investigates these particular “kinematic graphs” that show distance, velocity and acceleration versus time while this terrific paper by Priti Shah and James Hoeffner reviews this graph-as-cartoon misconception and many others, with implications for instruction.

Almost every instructor in a science, technology, engineering or math (STEM) field,  and many in the Humanities, too, lament their students’ inability to “use graphs”. I sympathize with them. But also with their students: graph interpretation is one of those areas, I believe, where expert-blindness, also called unconscious competence by Sprague and Stewart (2000), is most visible: experts don’t even realize what they’re doing anymore. By the time they’re  standing at the front of the classroom, instructors may have looked at hundreds, even thousands, of graphs. We look at a graph and BAM! we see it’s key idea. I don’t even know how I know. I just…do.

Well, because of the line of work I’m in, I’m forcing myself to slow down and try to reconstruct what’s going on in my head. Task analysis, they call it. When did I read the axis labels? When did I notice their range and scaling? Was that before or after I’d read the title and (especially in a journal) the caption? When you finally get to looking at the data, how do you recognize the key feature – an outlier, the slope of the line, the difference between 2 bars of a histogram – that support the claim?

The ease with which we interpret graphs makes it difficult for us to teach it:

What do you mean it’s a guy going up a hill and down again?! Obviously he’s standing still for the first second – slope equals zero! D’uh!

I’ve been wrestling with this problem for a while. Every time it comes up, like it did this week, I dig out a piece I wrote in 2010 when I was part of the Carl Wieman Science Education Initiative (CWSEI) at the University of British Columbia. It was for an internal website so the version reproduced has been updated and some names have been removed.

Interpreting and Creating Graphs

I was at a 3-day meeting called Applying Cognitive Psychology to University Science Education which brought together science education researchers from the CWSEI in Vancouver and CU-SEI in Boulder and the Applying Cognitive Psychology to Enhance Educational Practice (ACPEEP) Consortium (or “star-studded” consortium, as CU-Boulder’s Stephanie Chasteen describes it.)

The skill of interpreting graphs came up a number of times. On the last day of the meeting, a group of us sat down to think about what it means to use a graph. One of us brought up the “up a hill and down again” interpretation of graphs in physics. An oceanographer in the group said she’d like to be able to give her students a complex graph  like this one and ask them to tell her what’s going on:

Vostok Petit data
Graph of CO2 (Green graph), temperature (Blue graph), and dust concentration (Red graph) measured from the Vostok, Antarctica ice core as reported by Petit et al., 1999. (Image and caption via Wikimedia Commons)
(Psst – how long did it take you to spot the 100,000-year cycle in the C02 levels? Not very long? How did you do that?) After thinking about the skills we ask our students for, a colleague sketched out a brilliant flow chart that eventually evolved into this concept map about graphing:


"Using graphs" means creating a graph (red arrows) and extracting information from a graph (green arrows).
“Using graphs” can mean drawing a graph (green arrows) or getting information from a graph (red arrows).

We see the information flowing inwards to create a graph and information flowing outwards to interpret a graph.

Creating a graph

Students should be able to use words and stories, mathematical models and equations, and numbers/data to create a graph. All of this information should be used to select the graph type – time series, histogram, scatter plot, y vs x, etc. – based on what we want to use the graph for, the type of data and what best tells the story we want to tell. Once selected, a useful graph should have

  • axes (for given variables, for combinations of variables that produce linear relations) with scale, range, labels
  • uncertainty, if applicable
  • visible and accurate data
  • title, legend if necessary
  • for graphs of functions, in particular, the graph includes (and is built from) characteristics of the function like asymptotes, intercepts, extreme points, inflection points

An instructor could assess a student’s graph with a graphing rubric with criteria like

  1. Does the graph have appropriate axes?
  2. Are the data accurately plotted?
  3. Does the graph match the characteristics of the function f(x)?
  4. and so on

The paper by Priti Shah and James Hoeffner reviews research into what people see when they look at a graph. It provides evidence for what does (and doesn’t) work. For example, if a graph shows the amount of some quantity, the amount should be the vertical axis because people see that as the height of the stack. On the other hand, if the graph is about distance traveled, distance should be the horizontal axis because that’s how people travel. One of my favourite snippets from Shah and Hoeffner: “When two discrete data points are plotted in a line graph, viewers sometimes describe the data as continuous. For example, a graph reader may interpret a line that connects two data points representing male and female height as saying, ‘The more male a person is, the taller he/she is’.” (p. 52) Their finding, as they say, have “implications for instruction.”

Interpreting a graph

More often in our Science classes, we give students a graph and ask them to interpret it. This is a critical step in figuring out and describing the underlying (that is, responsible) process. Just what is it we want students to do with a graph?

describe Describe in words what the graph is showing:

Given two distance vs time graphs, which person is walking faster?

What is happening here?

How have the CO2 levels changed over the last 400 000 years? [And we’ll save “why has it been doing that?” for the next question.]

interpolate and predict Use the mathematical model or equation to extract values not explicitly in the data:

Give the graph of a linear function and ask for the expected value of another (the next) measurement.

Give the graph, ask for the function y=f(x)

Find the slope of the graph

read off data Extract numbers already present in the data:

What is the value of y for a given x?

In what years did the CO2 levels reach 280 ppmv?

When is the man farthest from the starting point?

Join the discussion

I’m always looking to collect examples of graphs—the ones students in your discipline have trouble with. It’s very likely we’re having similar issues. Perhaps these issues could someday be addressed with a graphing concept inventory test that expand’s on Beichner’s Test of Understanding Graphs in Kinematics (TUG-K).

[Update: Just prior to publishing this piece, I looked more closely at the “guy out for a walk” graph. He travels 40 m in 2 seconds – that’s 20 metres per second or 20 x 3600 = 72 000 m per hour. Seventy-two km/h? He’s definitely not walking. Perhaps I should have said, “Here’s a graph showing some guy out for a drive.” I’ll stick with the original, though. Yeah, maybe I did it on purpose, just to make you put up your hand and explain your answer…]

References

  1. Elby, A. (2000). What students’ learning of representations tells us about constructivism. Journal of Mathematical Behavior 19, 4, 481-502.
  2. Beichner, R.J. (1994). Testing student interpretation of kinematics graphs. Am. J. Phys. 62, 8, 750-762.
  3. Shah, P. & Hoeffner, J. (2002). Review of Graph Comprehension Research: Implications for Instruction. Educational Psychology Review 14, 1, 47-69.
  4. Sprague, J., Stuart, D. & Bodery, D. (2013). The Speaker’s Handbook (10/e). Boston: Wadsworth, Cengage Learning.

A Tale of Two Comets: Evidence-Based Teaching in Action

Comet McNaught
Comet McNaught wow'd observers in the Southern Hemisphere in 2007. (Image by chrs_snll on flickr CC)

We often hear about “evidence-based teaching and learning.” In fact, it’s a pillar of the approach to course development and transformation that we follow in the Carl Wieman Science Education Initiative.

It’s a daunting phrase, though, “evidence-based teaching and learning.” It sounds like I have to find original research in a peer-reviewed article, read and assimilate the academic prose, and find a way to apply that in my classroom. Does a typical university instructor have the time or motivation? Not likely.

It doesn’t have to be like that, though. There are quicker, easier analyses and subsequent modifications of materials that, in my opinion, qualify as evidence-based teaching. Let me share with you an example from an introductory, general-ed “Astro 101” astronomy course. First, a bit of astronomy.

Comets and their tails

Comets are dusty snowballs of water ice and other material left over from the formation of the Solar System. The comets we celebrate, like Comet Halley, travel along highly-elongated, elliptical orbits that extend from the hot, intense region near the Sun to the cold, outer-regions of the Solar System.

Comet's tail
A comet's tails point away from the Sun. The comet is orbiting clockwise in this diagram so the yellow dust tail trails slightly behind the blue ion tail.

As comets approach the Sun, like Comet Halley does every 76 years, the comet’s nucleus warms up. The ice turns to gas which creates a sometimes-spectacular tail. The tail grows larger and larger, streaming out behind the comet until it rounds the Sun and begins to head back out into the Solar System. That’s when something interesting happens. Well, another interesting thing, that is. You may think the comet’s tail streams out behind like the exhaust trail (the contrail) of an airplane but once the comet rounds the Sun, the tail swings around ahead of the comet. Yes, the nucleus follows the tail. That’s because the tail is blown outward by the solar wind so that the tail of a comet always points away from the Sun. (Well, there are actually 2 tails. The ion tail is strongly influenced by the solar wind – it’s the one blown directly away from the Sun. A dust trail also interacts gravitationally with the Sun, causing it to curl out behind the ion tail.)

Teaching and learning

It’s not what you’d expect, the tail wagging the dog. And that’s make it a great opportunity for peer instruction and follow-up summative assessment.

Last December, the course’s instructor and I sat down to write the final exam. We could have used a multiple-choice question

The ion tail of a comet always…
A) points away from the Sun
B) trails behind the comet
C) D) E) [other distractors]

Or perhaps a more graphical version, like this one from the ClassAction collection of concept questions:

Comet Trajectories concept question from ClassAction
A concept question about the shape of a comet's tail from the ClassAction collection at the University of Nebraska - Lincoln. The correct answer is C, by the way.

Both of these questions are highly-susceptible to success-by-recognition where the student doesn’t really know the answer until s/he recognizes it in the options. “What do comets’ tails do again? Oh right, they point away from the Sun.”

Instead, we decided on a question that better assessed their grasp of how comet tails behave. The cost is, this question is more difficult to mark:

Assessment

Oh, the question was marked out of 2, 1 pt for each tail pointing away from the Sun. That’s not the kind of assessment I mean, though. I’m talking about the assessment that goes into evidence-based teaching and learning. How did the students respond to this question? What it a good test of their understanding?

I went through the stack of N=63 exams and sorted them into categories. It wasn’t hard to come up with those categories, it was pretty obvious after the first 10 papers.

  • 46 students: tails of equal lengths pointing away from the Sun. Yep, 2 out of 2.
  • 5 students: tails of equal lengths pointing away from the Sun with guidelines. Nice touch, reinforcing why you drew the tails the way you did. 2 out of 2. And some good karma in case you need the benefit of the doubt later on the exam.
  • 3 students: drew ion tail correctly and dust tail mostly correct. Good karma for adding extra detail, though the dust trail is too much traily-behindy. Be careful, kids, when you write more than is asked for – you could lose marks.
  • 1 student: tails with (correctly) unequal lengths pointing away from the Sun. Oh, very good! Maybe 3 out of 2 for this answer!
  • 8 students: various incorrect answers. I like this first one (“Oh, geez, there’s something about pointing and the Sun, isn’t there? Ummm…”)

Evidence-based teaching

It’s clear that the vast majority of students grasp the concept that a comet’s tail points away from the Sun. Terrific!

So why are we wasting this question on such an obvious bit information, then? Let me put that another way:  These students are evidently, and I mean evidently, capable of learning more about comets. We thought this <ghost> “Oooooo, watch oouuttt! Comet tails point awaaaaayyyy from the Suuuun…” </ghost> concept would be difficult enough. Nope, they surprised us. So let’s crank it up next year. Let’s explore the difference between the ion and dust tails. And that the length of the tail changes as the comet approaches and recedes from the Sun. Next year, the answer that gets full marks will be the one with

  • 2 tails at each position,
  • the ion tail pointing away from the Sun,
  • the dust tail lagging slightly behind the ion tail,
  • short tails at the far location, large tails at the close location

That’s evidence-based teaching and learning. Find out what they know and then react by building on it and leveraging it to explore the concept deeper (or shallower, depending on the evidence.) It’s not difficult. It doesn’t require poring over Tables of Contents, even in the excellent Astronomy Education Review. All it requires is small amount of data collection, analysis and ability to use the information. Hey, those are all qualities of a good scientist, aren’t they?

Situated Learning

[I wrote this review of situated learning, also known as situated cognition, in 2009 for the internal communications discussion board we use in the Carl Wieman Science Education Initiative. I go back to it often enough, mostly to find the reference for the amazing paper by James Paul Gee, that I’m reposting here.]

We’ve all seen it, and probably done it, too. An instructor has a really interesting problem to tackle in a course, a problem that synthesizes many concepts. So the instructor carefully presents each concept, one after another, building anticipation and excitement for the big day when everything comes together. And when the big day arrives, a month into the term, the students don’t seem to get it. “But we just spent a month getting ready for this! Why aren’t you excited? Can’t you remember concepts A, B, C, D, E, F and G?”

Uh, no. The problem is, concepts A thru G were presented without any context. They are disembodied or decontextualized knowledge.  There’s no scaffolding, no motivation to grab the students’ attention. The promise of excitement a month from now isn’t enough. As this is a scenario I’m facing, I needed some research to support my argument for change. At Carl’s suggestions, with great help from Wendy Adams (CU Boulder), I put together a brief summary of what we know about the failures of decontextualized knowledge, or better yet, the profound benefits of situated cognition.

For thousands of years, novices have become experts through apprenticeship: the master trains the novice, not just with reading assignments and homework, but by teaching the craft in situ. The novice accumulates the craft’s concepts as needed. The novice learns simultaneously, both the knowledge and how to use it. As Brown, Collins and Duguid (1989) write,

by ignoring the situated nature of cognition, education defeats its own goal of providing usable, robust knowledge.

This paper is an excellent discussion. The authors describe two benefits to situated cognition:

  1. “Learning from dictionaries, like any method that tries to teach abstract concepts independently of authentic situations, overlooks the way understanding is developed through continued, situated use.” This echoes Chapter 3: Learning and Transfer of How People Learn. Teaching in context (and then in slightly different situations) increases the “flexibility” of students’ knowledge, aiding transfer.
  2. “[Students] need to be exposed to the use of a domain’s conceptual tools in authentic activity – to teachers acting as practitioners and using these tools in wrestling with problems of the world.” This one surprised me because it didn’t even occur to me and it’s probably more important than the first. Students in a situated learning environment get “enculturated” (Brown et al., 1989) into the practice of how to study the field, not just the field’s concepts.

Okay, great. But how do you do it? How do you “enculturate” your students? What kinds of activities or curricula work?

Mayer and Wittrock, in Chapter 13: Problem Solving of the Handbook of Educational Psychology (Winne and Alexander, 2006) describe a wide range of methods for teaching problem solving, many of which have a flavour of teaching and learning in context.

Donovan and Bransford in How Students Learn (2005), a follow-up to How People Learn, collect together a number of case studies about teaching and learning science.

Sabella and Redish (2007) give some advice for physics instruction, but the messages are much more general:

[C]onceptual knowledge is only one part of what students need to know in order to solve physics problems. They also need to know how and when to use that knowledge.

Finally, if you read only one more paper after Brown et al., read this fantastic how-to article by James Paul Gee. He studies literacy and he’s a (the?) video gaming guru. This article, “Learning by Design: good video games as learning machines” (2005) lists 13 principles that education should have. Each principle is matched to a video game where that skill or activity is best exemplified (they’re all long, role-playing games like Halo and Tomb Raider where you must accumulate skills to win). And for us, he kindly translates the principles into what educators need to do to incorporate these principles into our teaching, like

skills are best learned as strategies for carrying out meaningful functions that one wants and needs to carry out.

In conclusion, situated cognition (or situated learning) has benefits far beyond helping students hang concepts onto the scaffold in the right places. It introduces them to how experts in the field practice their craft.

References

J.S. Brown, A. Collins, and P. Duguid, “Situated Cognition and the Culture of Learning,” Educational Researcher 18, 32 (1989).

J.D. Bransford, A.L. Brown, R.R. Cocking (Eds.) How people learn: Brain, mind, experience, and school. (National Academies Press, Washington, DC, 2000).

R.E. Mayer and M.C. Wittrock, in Handbook of Educational Psychology (2nd ed.), edited by P.H. Winne and P.A. Alexander (Mahwah, NJ: Lawrence Erlbaum Associates, 2006), 287.

M.S. Donovan and J.D. Bransford (Eds.) How students learn: Science in the classroom. (National Academies Press, Washington, DC, 2005).

M. Sabella and E.F. Redish, “Knowledge activation and organization in physics problem-solving,” Am. J. Phys. 75, 1017 (2007).

J.P. Gee, “Learning by Design: good video games as learning machines,” E-Learning 2, 5 (2005).

Navigation