In the early 2010’s, I read Ken Bain’s “What the Best College Teachers Do” (2004). One part jumped out at me then and I continue to quote and use it over and over. When describing the best college teachers’ classrooms, Bain writes
More than anything else, the best teachers try to create a naturalcriticallearning environment: natural because students encounter skills, habits, attitudes, and information they are trying to learn embedded in questions and tasks they find fascinating – authentic tasks that arouse curiosity and become intrinsically interesting, critical because students learn to think critically, to reason from evidence, to examine the quality of their reasoning using a variety of intellectual standards, to make improvements while thinking, and to ask probing and insightful questions about the thinking of other people.
(p. 99)
He observes that in these natural, critical learning environments,
students encounter safe yet challenging conditions in which they can try, fail, receive feedback, and try again without facing a summative evaluation.
(p. 108)
The try, fail, receive feedback, try again cycle inspired me to create this graphic (feel free to use it, it’s shared under CC-BY):
In the best college teachers classrooms, “students encounter safe yet challenging conditions in which they can try, fail, receive feedback, and try again without facing a summative evaluation” (Bain, 2004) (Graphic created by Peter Newbury, shared under CC-BY)
I frequently thinkabout this learning cycle and happily encourage instructors and other educational developers to think about it, too, and build it into their courses and support for those who teach. In other words, it’s always active in my head, always ready to leap up and join the conversation.
[L]earning from mistakes is a common aspect of Indigenous pedagogy, as it involves experiential learning and self-development. In this view, mistakes plus correction equals learning. Indigenous communities and families have a cultural process for “fixing” a mistake by creating a safe place to acknowledge your mistake, to fix it, and then learn from it…After the process of acknowledging and fixing a mistake, it’s then time to let go, move forward, and continue to work together.
(p. 34)
🤯 Mind 🤯 Blown 🤯
Let’s take a close read to compare these Western and Indigenous approaches to teaching:
What the best college teachers do
Pulling Together
students encounter skills, habits, and information they are trying to learn embedded in questions and (authentic) tasks they find fascinating
it involves experiential learning and self-development
students encounter safe yet challenging conditions
creating a safe place to acknowledge your mistake
try, fail, receive feedback, and try again
mistakes plus correction equals learning
try, fail, receive feedback, and try again
acknowledge your mistake, to fix it, and then learn from it
without facing a summative evaluation
it’s then time to let go, move forward, and continue to work together
I’m so happy to continue confronting and correcting my colonial misconception that Indigenizing the curriculum means setting aside my Western knowledge and practices. How people learn is the same, and effective teaching is effective teaching, however we label and categorize it.
“Misconception” is one of those words that makes you slump your shoulders and sigh. It’s not inspiring like “creativity” or “glee.” In fact, in education circles we often resort to “alternate conception” so we’re not starting the conversation at a bad place.
In this post, I want to share with you some beautiful new research on how misconception affects teaching and learning.
Here’s what Sadler et al. did in the present study.
They created a 20-question, multiple-choice quiz based on concepts taught in middle school science: properties and changes in properties of matter, motion and forces, and transfer of energy. They chose concepts where kids have a common misconception, for example,
Electrical circuits provide a means of transferring electrical energy when heat, light, sound and chemical changes are produced (with common misconception that electricity behaves in the same way as a fluid.) (p. 12)
With the test in hand, they recruited 100’s of seventh and eighth grade science teachers in 589 schools across the U.S. They asked them to give the test at the beginning, middle and end of the year, to look for signs of learning. By the end of testing, there were matching sets of tests from 9556 students and 181 teachers. In other words, a big enough N that the data could mean something.
By looking at the students’ responses, the authors were able to classify the 20 questions into 2 types:
for 8 questions, some students got them right, some got them wrong, with no pattern in the wrong answers. They call these “no misconception” questions.
for 12 questions, when students got them wrong, 50% or more chose the same incorrect answer, a carefully chosen distractor. These questions are called “strong misconception” questions.
Sadler et al. also had the students write math and reading tests. From their scores, the students were classified as “high math and reading” or “low math and reading”.
They did something else, too, and this is what makes this study interesting. They asked the teachers to write the test. Twice. The first time, the teachers answered as best they could. Their scores are a measure of their subject matter knowledge (SMK). The second time, the teachers were asked to identify the most common wrong answer for each question. How often they could identify the common wrong answer in the strong misconception questions is the teachers’ knowledge of student misconception (KoSM) score.
With me so far? Students with high or low math and reading skills have pre- and post-scores to measure their science learning gain. Teachers have SMK and KoSM scores.
Do you see where this is going? Good.
There’s a single graph in the article that encapulates all the relationships between student learning and teachers SMK and KOSM. And it’s a doozie of a graph. Teaching students how to read graphs, or more precisely, teaching instructors how to present graphs so students learn how to interpret them, is something I often think about. So, if you’ll permit me, I’m going to present Sadler’s graph like I’d present it to students.
First, let’s look at the “architecture” of the axes before we grapple with the data.
Let’s look at the axes of the graph first, before the data overwhelm us. SMK = teachers’ subect matter knowledge; KoSM is the teachers’ knowledge of student misconceptions. (Adapted from Sadler et al. (2013))The x-axis give the characteristics of the science teachers (no SMK,…, SMK & KoSM) who taught the concepts for which students show no misconception or strong misconception. Why are there 3 categories for Strong Misconception but only 2 for No Misconception? Because there is no misconception and no KoSM on the No Misconception questions. What about the missing “KoSM only” condition? There were no teachers who had knowledge of the misconceptions but no subject matter knowledge. Good questions, thanks.
The y-axis measures how much the students learned compared to their knowledge on the pre-test given at the beginning of the school year. This study does not use the more common normalized learning gain, popularized by Hake in his “Six-thousand student” study. Instead, student learning is measured by effect size, in units of the standard deviation of the pretest. An effect size of 1, for example, means the average of the post-test is 1 standard deviation higher than the average of the pre-test, illustrated in the d=1 panel from Wikipedia. Regardless of the units, the bigger the number on the y-axis, the more the students learned from their science teachers.
And now, the results
This is my post so I get to choose in which order I describe the results, in a mixture of the dramatic and the logical. Here’s the first of 4 cases:
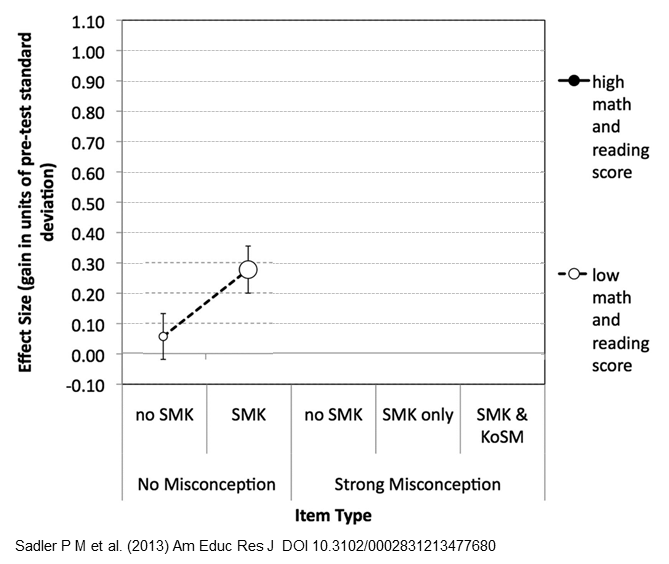
The students who scored low on the reading and math tests didn’t do great on the science test either, though the ones who had knowledgeable teachers (SMK) did better. Oh, don’t be mislead into thinking the dashed line between the circles represents a time series, showing students’ scores before and after. No, the dashed line is there to help us match the corresponding data points when the graph gets busy. The size of the circles, by the way, encodes the number of teachers with students in the condition. In this case, there were not very many teachers with no SMK (small white circle).
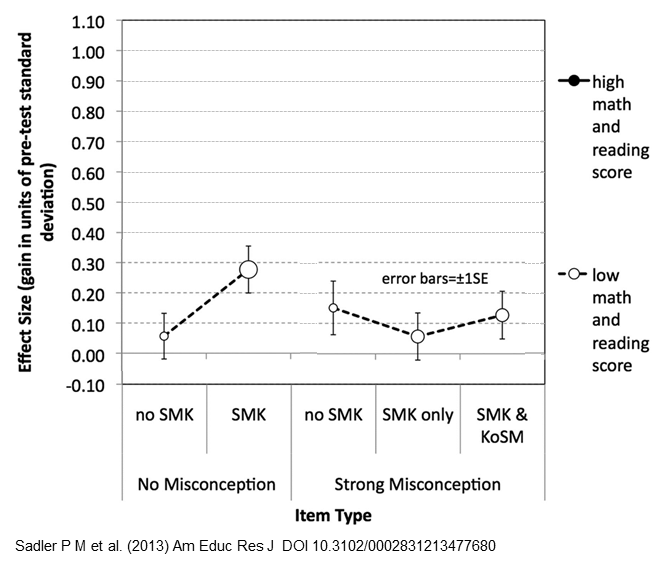
Next, here are the learning gains for the students with low math and reading scores on the test questions with strong misconceptions:
Students with low math and reading scores did poorly on the strong misconception questions, regardless of the knowledge of their teachers. (Adapted from Sadler et al. (2013))
Uh-oh, low gains across the board, regardless of the knowledge of their teachers. Sadler et al. call this “particularly troubling” and offer these explanations:
These [strong misconception questions] may simply have been misread, or they may be cognitively too sophisticated for these students at this point in their education, or they many not have tried their hardest on a low-stakes test. (p. 22)
Fortunately, the small size of the circles indicates there were not many of these.
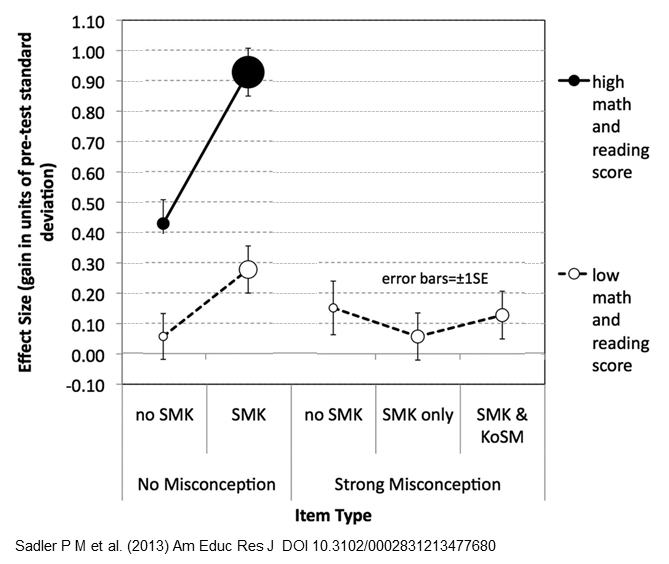
What about the students who scored high on the math and reading tests? First, let’s look at their learning gains on the no-misconception questions. [Insert dramatic drum-roll here because the results are pretty spectaculars.]
Students with knowledgeable teachers exhibited huge learning gains. (Adapted from Sadler et al. (2013))
Both black circles are higher than all the white circles: Even the students with less-knowledgeable teachers (“no SMK”) did better than all the students with low math and reading scores. The important result is how much higher students with knowledgeable teachers scored, represented by the big, black circle just north of effect size 0.9. Science teachers with high subject matter knowledge helped their students improve by almost a full standard deviation. Rainbow cool! The large size of that black circle says this happened a lot. Double rainbow cool!
Finally we get to the juicy part of the study: how does a teacher’s knowledge of the students’ misconceptions (KoSM) affect their students’ learning?
Subject matter knowledge alone isn’t enough. To get significant learning gains in their students, teachers also need knowledge of the misconceptions. (Adapted from Sadler et al. (2013))
Here, students with knowledgeable teachers (I guess-timate the effect size is about 0.52) do only slightly better than students with less knowledgeable teachers (effect size around 0.44). In other words, on concepts with strong misconceptions, subject matter knowledge alone isn’t enough. To get significant learning on these strong misconception concepts, way up around 0.70, teachers must also have knowledge of those misconceptions.
Turning theory into practice
Some important results from this ingenious study:
students with low math and reading skills did poorly on all the science questions, despite the knowledge of their teachers, once again demonstrating that math and reading skills are predictors of success in other fields.
Teachers with subject matter knowledge can do a terrific job teaching the concepts without misconceptions, dare we say, the straightforward concepts. On the trickier concepts, though, SMK is not enough.
Students bring preceptions to the classroom. To be effective, teachers must have knowledge of their students’ misconceptions so they can integrate that (mis)knowledge into the lesson. It’s not good enough to know how to get a question right — you also have to know how to get it wrong.
Others, like Ed Prather and Gina Brissenden (2008), have studied the importance of teachers’ pedagogical content knowledge (PCK). This research by Sadler et al. shows that knowledge of students’ misconceptions most definitely contributes to a teacher’s PCK.
If you use peer instruction in your classroom and you follow what Eric Mazur, Carl Wieman, Derek Bruff and others suggest, the results of this study reinforce the importance of using common misconceptions as distractors in your clicker questions. I’ll save it for another time, though; this post is long enough already.
Epilogue
Interestingly, knowledge of misconceptions is just what Derek Muller has been promoting over at Veritasium. The first minute of this video is about Khan Academy but after that, Derek describes his Ph.D. research and how teachers need to confront students’ misconceptions in order to get them to sit up and listen.
If you’ve got 8 more minutes, I highly recommend you watch. Then, if you want to see how Derek puts it into practice, check out his amazing “Where Do Trees Get Their Mass From?” video:
Update 6/6/2013 – I’ve been thinking about this paper and post for 3 months and only today finally had time to finish writing it. An hour after I clicked Publish, Neil Brown (@twistedsq on Twitter) tweeted me to say he also, today, posted a summary of Sadler’s paper. You should read his post, too, “The Importance of Teachers’ Knowledge.” He’s got a great visual for the results.


![Let's look at the axes of the graph first, before the data blind us. (Adapted from [1])](https://peternewbury.org/wp-content/uploads/2018/03/SadlerMisconceptionGraphs_0.png)